
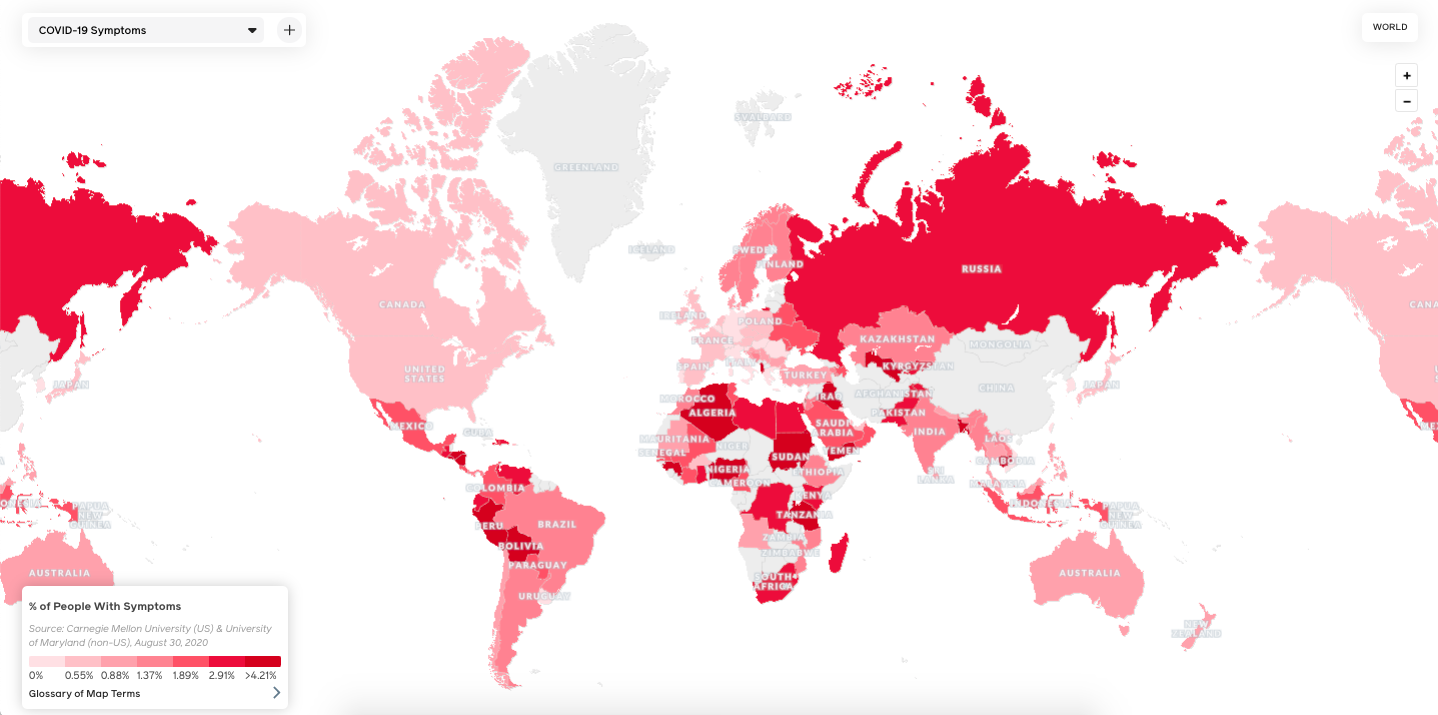
The news: Since April, the Delphi research group at Carnegie Mellon University has been compiling one of the world’s largest databases for covid-19 symptom tracking. Now it’s launching a new challenge with Facebook and other partners to crowdsource data projects for improving the nation’s pandemic response.
The data: The Delphi group, one of the best flu-forecasting teams in the US, has been surveying people in the US about their symptoms via Facebook to help with the CDC’s covid forecasting efforts. The latest survey asks 36 questions about whether you have or know someone with symptoms, how often you come in contact with other people, whether you’ve been experiencing mental-health or financial challenges, and more. Every day, Facebook randomly selects a population of users to push the survey to in their news feeds. The answers are then sent directly to Delphi without the company ever viewing them.
As of May, the University of Maryland has joined the collaboration and has been administering an international version of the survey. The questions differ slightly because of data privacy regulations and the World Health Organization’s changing needs. Aggregated versions of both data sets will be released to challenge participants, and researchers can request special access to anonymized, de-aggregated versions of the data if they need it.
A wealth of analyses: Since the project began, Delphi says, it’s collected roughly 10 million survey responses in the US and 15 million abroad. More than 85% of US respondents who answer at least two questions fill out the survey to the end—a completion rate that far exceeds the researchers’ initial expectations. The research group has partnered with about a dozen other organizations to analyze the wealth of data for various purposes. Among others, they hope to develop local forecasting models for hospitals and study the impact of lockdowns on mental health.
“There is so much in this data, or potentially so much in this data, there’s no way that we alone could analyze the data and deliver every insight from it,” says Alex Reinhart, an assistant teaching professor in CMU’s Department of Statistics & Data Science, who is part of the team running the challenge. “To my knowledge, this is one of the largest surveys ever conducted outside of the census. So our feeling is that the symptom surveys would be at their most useful if many researchers who are studying the pandemic are able to use them.”
Fresh ideas: The challenge organizing team hopes to attract a broad range of participants, from researchers to laypeople, who can contribute fresh ideas for using the data. “I’m interested in basically anything new,” Reinhart says. “Any approach that makes all of the data we collect meaningful to people who just want to know: ‘What should I be doing in my community? How does all this information help me make a specific decision?’” Perhaps this will come in the form of better forecasting methods or simple dashboards, he adds.
The challenge will be accepting submissions through September 29. Once the finalists are selected, the goal will be to connect them with relevant partner organization, public health officials, or other parties that might benefit from the proposed ideas.


Recent Comments